Short answer: the mean is the total divided by the count, the median is the middle value when the numbers are in order, and the mode is the most common value. Outliers change the mean most.
Three Ways to Describe the Middle
When someone says that a typical score is 65, they could mean any of three things. Mean, median and mode are all called averages, but they answer different questions. The mean shares the total equally. The median finds the middle position. The mode finds the most frequent value. Knowing which one you have, and which one fits your data, is the difference between a number that helps and a number that misleads.
The Three Definitions
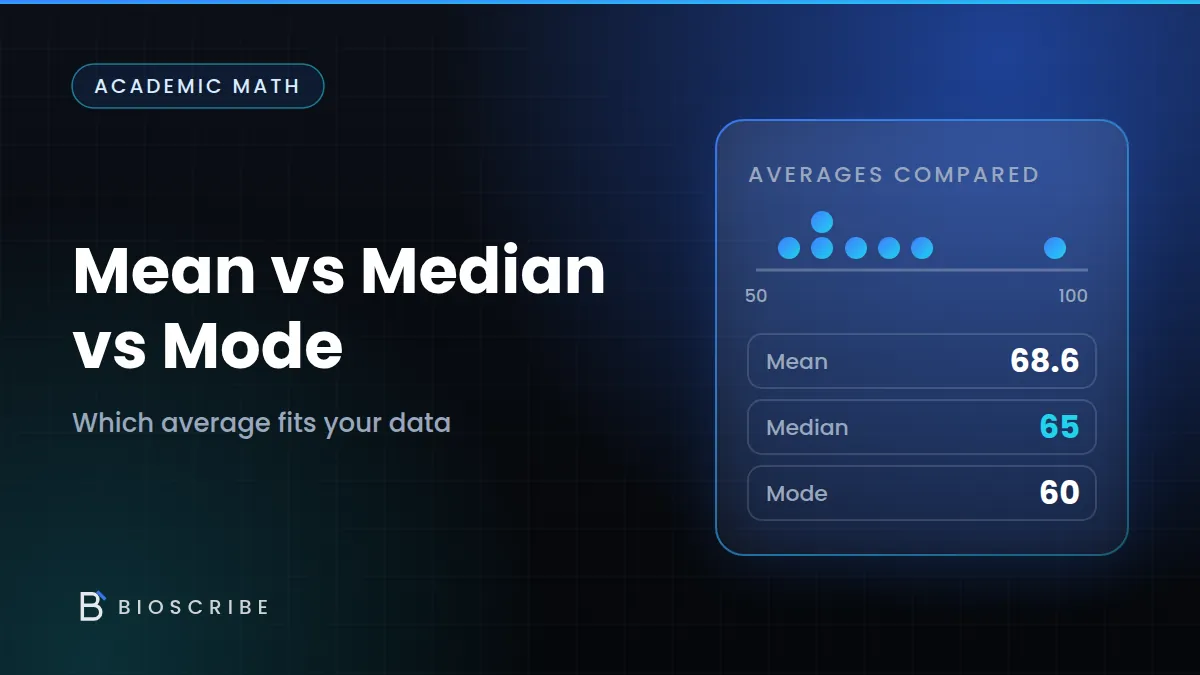
Take seven test scores: 55, 60, 60, 65, 70, 75 and 95.
- Mean: add and divide. The total is 480, so the mean is 480 ÷ 7 = 68.57.
- Median: put the values in order and take the middle one. With seven values, the 4th is 65, so the median is 65.
- Mode: the value that appears most often. 60 appears twice, so the mode is 60.
The three results are different, even though they describe the same scores. That is normal when the data is not perfectly symmetrical.
Quick Comparison
| Measure | Question it answers | Affected by extreme values? | Result here |
|---|---|---|---|
| Mean | What if the total were shared equally? | Yes, strongly | 68.57 |
| Median | What is the middle value? | Slightly | 65 |
| Mode | What is the most common value? | No | 60 |
What an Outlier Does
An outlier is a value far from the rest. Suppose a missed test adds a score of 0 to the data. The eight values are now 0, 55, 60, 60, 65, 70, 75 and 95. The total is still 480, but it is shared over 8 values, so the mean falls to 480 ÷ 8 = 60. The median becomes the average of the 4th and 5th values, (60 + 65) ÷ 2 = 62.5. The mode stays at 60. The mean dropped by 8.57 points, and the median by only 2.5.

When to Use the Mean
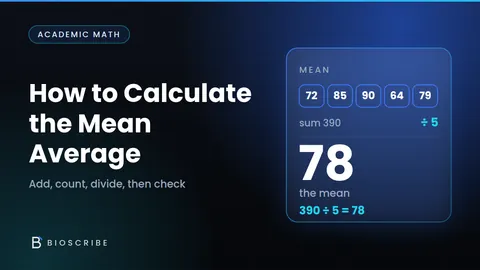
Use the mean when the data is roughly symmetrical and every value should count, such as the marks on a set of similar quizzes. It is also the right choice when you need a total, because mean × count gives the sum back. Many grading systems use the mean for this reason. Our guide on how to calculate the mean average covers the method.
When to Use the Median
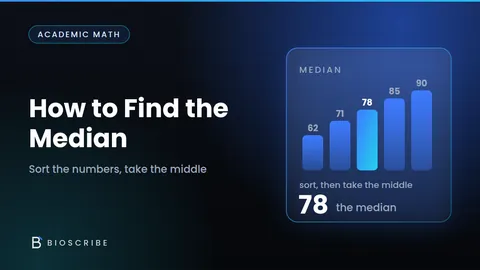
Use the median when the data has outliers or is skewed. Suppose your weekly study hours over five weeks are 10, 12, 12, 14 and 40, where the 40 was a one-off exam week. The mean is 88 ÷ 5 = 17.6 hours, but that is higher than four of the five weeks. The median is 12 hours, which describes a typical week far better. Our guide on how to find the median shows how to calculate it.
When to Use the Mode
The mode is the best summary when you want the most common outcome, such as the most frequent grade in a class, the usual number of classes missed or the most common commute time. It also works for categories that are not numbers, such as a favourite subject. A data set can have no mode, if no value repeats, or more than one. The values 2, 2, 5, 5 and 8 have two modes, 2 and 5.
A Quick Test: Compare the Mean and the Median
If the mean and the median are close, the data is roughly symmetrical and either works. If they are far apart, the data is skewed. In the study-hours example, the mean (17.6) is well above the median (12), which tells you that a few large values are pulling the mean up. In the original test scores, the mean (68.57) is slightly above the median (65), which shows a small upward pull from the 95.
The Range: How Spread Out the Data Is
Averages say nothing about spread. The range is the maximum minus the minimum, which for the seven scores is 95 − 55 = 40. After adding the zero, the range becomes 95 − 0 = 95. Reporting the range alongside an average warns readers about unusual values. Two classes can have the same mean and very different ranges, so a single number never tells the whole story.
Which One Should You Report?
Choose the measure that answers your question, and say which one you used. For marks on similar quizzes, the mean is usual. For something skewed, such as study hours or time to finish a task, the median is safer. For the most common outcome, use the mode. When in doubt, give the mean and the median together, since the gap between them is informative.
A Second Example: Class Marks
Eight students score 38, 42, 45, 47, 50, 52, 55 and 88. The total is 417, so the mean is 417 ÷ 8 = 52.13. The median is the average of the 4th and 5th values, (47 + 50) ÷ 2 = 48.5. No value repeats, so there is no mode. The mean is higher than the median by almost 4 points, because the single 88 pulls it up. If you wanted to describe how a typical student did, 48.5 would be more honest than 52.13.
All Three From a Frequency Table
You can find all three averages from a table of counts. Suppose 3 students scored 5, 5 students scored 6 and 2 students scored 7. The mean is (3 × 5 + 5 × 6 + 2 × 7) ÷ 10 = 59 ÷ 10 = 5.9. The median is the average of the 5th and 6th values in order. Both are 6, so the median is 6. The mode is 6 as well, since it has the highest count. Here the three measures are close, which suggests that the data is fairly balanced.
Reading an Average Honestly
When you read or report an average, ask three questions. Which average is it? How many values does it come from? Are there extreme values? A mean of 52 from eight students says less than the same mean from eight hundred, and a mean with a single outlier says less than one without. Giving two measures together, or the range alongside one, is a simple way to avoid misleading anyone, including yourself.
Common Mistakes to Avoid
- Using “average” without saying which one. Name the measure.
- Using the mean on skewed data. Check the median as well.
- Taking the middle of an unsorted list. Sort before finding the median.
- Forgetting that a mode may not exist. Some data has no repeated value.
- Ignoring spread. Report the range with the average.
Check Your Work With BioScribe
BioScribe’s Average Calculator finds the average of a set of scores. Enter the seven scores above, then add a zero to see how much the mean moves.
Frequently Asked Questions
Which is the best average to use?
It depends on the data. Use the mean for symmetrical data, the median when there are outliers, and the mode for the most common value.
Can the mean and median be the same?
Yes. In perfectly symmetrical data they are equal, and they are often close in data without extreme values.
Can there be more than one mode?
Yes. If two values appear equally often, both are modes. If no value repeats, there is no mode.
Which average do grades usually use?
Most grading systems use the mean, sometimes weighted. The median is more often used to describe a class or a skewed result.
Why does the mean change more than the median?
The mean uses every value, so one extreme value shifts the total. The median depends on position, so an extreme value only moves it slightly.
Conclusion
The mean shares the total, the median finds the middle and the mode finds the most common value. Outliers move the mean far more than the median, so compare them before you choose. Say which measure you used, and if the data is skewed, report the median or both.