Short answer: sort the numbers from smallest to largest. If there is an odd number of values, the median is the middle one. If there is an even number, it is the average of the two middle values.
What the Median Is
The median is the middle value of a set of numbers when they are arranged in order. Half the values are below it and half are above it. It answers the question “what is typical?” in a way that does not depend on extreme values, which makes it useful for scores, study hours, commute times and anything else where one unusual value could distort the picture. Our guide on mean vs median vs mode compares it with the other averages.
The Method
- Sort the values from smallest to largest.
- Count them. Call the count n.
- If n is odd, the median is the value in the middle position.
- If n is even, the median is the average of the two middle values.
Sorting is the step people skip, and it is the step that matters. The middle of an unsorted list is not the median.
Example With an Odd Number of Values
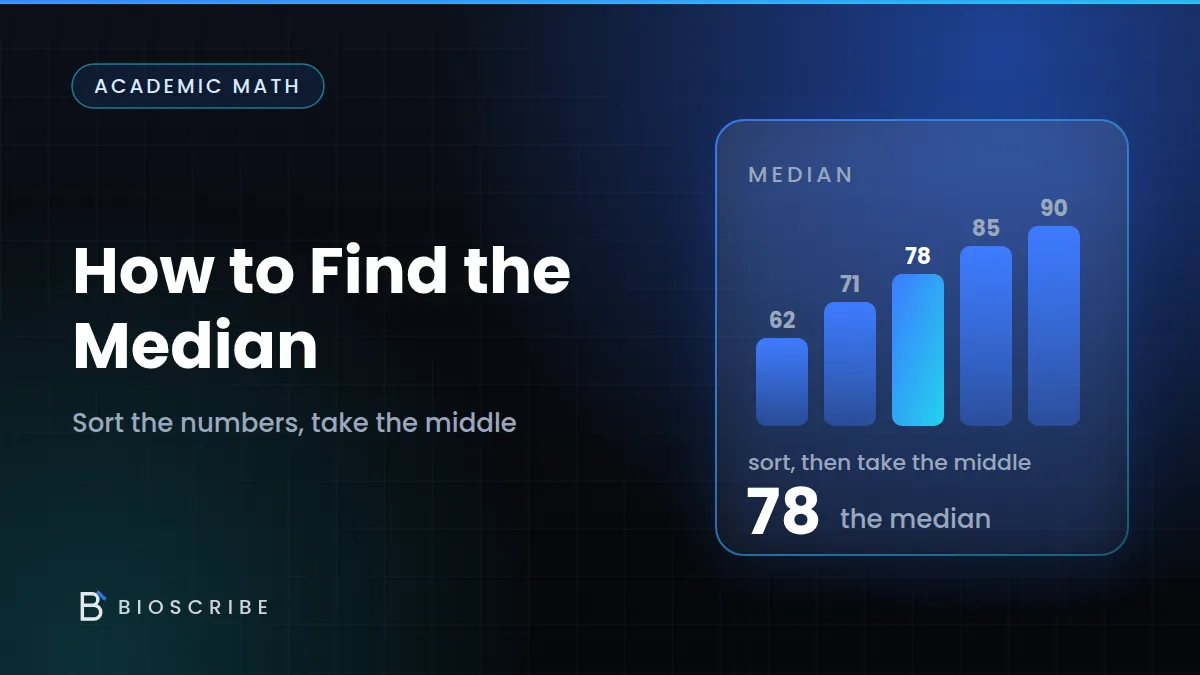
Your five test scores are 62, 85, 71, 90 and 78. Sorted, they are 62, 71, 78, 85 and 90. There are 5 values, so the median is the 3rd: 78. Two values lie below it and two above it. The unsorted list had 71 in the middle, which would have been the wrong answer.
Example With an Even Number of Values
Now a sixth score of 94 arrives. Sorted, the values are 62, 71, 78, 85, 90 and 94. There are 6 values, so there is no single middle one. The two middle values are the 3rd and 4th, 78 and 85. The median is their average: (78 + 85) ÷ 2 = 81.5. The median does not have to be one of the values in the set.
Finding the Position
You can find the middle position with a formula: position = (n + 1) ÷ 2. For n = 5, that is 3, so take the 3rd value. For n = 6, it is 3.5, which means halfway between the 3rd and 4th values, so average them. This is faster for larger sets. For 25 values, the median is the 13th. For 40 values, the position is 20.5, so average the 20th and 21st.
Median With Repeated Values
Repeated values do not change the method. Suppose a quiz is scored out of 10, with 3 students scoring 5, 5 students scoring 6 and 2 students scoring 7. Written in order, that is 5, 5, 5, 6, 6, 6, 6, 6, 7, 7. With 10 values, the median is the average of the 5th and 6th. Both are 6, so the median is 6. A frequency table lets you find the middle without writing every value, by counting up to the middle position.
Why the Median Resists Outliers
The five scores 62, 71, 78, 85 and 90 have a mean of 386 ÷ 5 = 77.2 and a median of 78. Add a very low score of 20. The mean falls to 406 ÷ 6 = 67.67, a drop of about 9.5 points. The sorted values are now 20, 62, 71, 78, 85 and 90, so the median is (71 + 78) ÷ 2 = 74.5, a drop of only 3.5. The median depends on position, not size, so one extreme value only shifts it by one place in the order.

When to Use the Median in Study Life
The median is a good summary of weekly study hours, because one exam week can inflate a mean. It describes a typical commute time, a typical time to finish an assignment, and the typical mark in a class where a few students scored very high or very low. It is also the better description when the data is skewed. If you report one number about “a typical week”, the median is usually fairer than the mean.
Finding the Median in a Spreadsheet
In a spreadsheet, list the values in a column and use =MEDIAN(B2:B7). The function sorts the values for you, ignores empty cells and handles even counts by averaging the two middle values. It is a good way to check a calculation done by hand, especially for longer lists.
A Worked Example With Study Hours
Your study hours over seven weeks are 14, 9, 12, 20, 11, 10 and 13. Sorted, they are 9, 10, 11, 12, 13, 14 and 20. There are 7 values, so the median is the 4th: 12 hours. The mean is 89 ÷ 7 = 12.71. They are close, because the 20 is only moderately high. If the 20 became 40, the median would stay at 12 while the mean would climb to 15.6, which shows why the median is stable.
Splitting the Data Further: Quartiles
The median splits the data in half, and you can split each half again. The median of the lower half is the first quartile, and the median of the upper half is the third quartile. For the seven study weeks, with the median left out, the lower half is 9, 10 and 11, so the first quartile is 10. The upper half is 13, 14 and 20, so the third quartile is 14. Methods for quartiles vary slightly between textbooks, so use the one your course gives.
When the Two Middle Values Are Equal
With an even count, the median is the average of the two middle values, and they are sometimes the same. For 4, 6, 6 and 8, the middle values are both 6, so the median is (6 + 6) ÷ 2 = 6. Nothing special happens. You still average the two, and the answer is simply that repeated value.
A Quick Check on Your Median
To check a median, count the values below it and above it. In a correct answer they are equal, apart from any repeats of the median itself. For the seven study weeks, three values are below 12 and three are above, which confirms it. If the counts are uneven, you have probably miscounted the position or forgotten to sort the list.
Common Mistakes to Avoid
- Not sorting first. The median is the middle of the ordered list.
- Picking one of the two middle values. With an even count, average them.
- Miscounting the position. Use (n + 1) ÷ 2 to check.
- Removing repeated values. Duplicates count, so keep them.
- Confusing the median with the mean. They are different calculations.
Check Your Work With BioScribe
BioScribe’s Average Calculator finds the average of a set of scores. Enter your own scores to compare the mean with the median.
Frequently Asked Questions
Does the median have to be one of the numbers?
No. With an even count it is the average of the two middle values, so it can fall between two numbers in the list.
What is the median of two numbers?
The average of the two. The median of 70 and 90 is 80.
How do I find the median of a large list?
Sort it, then use the position (n + 1) ÷ 2. For 25 values it is the 13th, and for 40 values it is the average of the 20th and 21st.
Do repeated numbers change how I find the median?
No. Keep every repeat in the list, sort, and find the middle position as usual.
When is the median better than the mean?
When there are extreme values or the data is skewed, such as study hours with one exam week or commute times with one very slow day.
Conclusion
To find the median, sort the numbers, then take the middle value, or the average of the two middle values when the count is even. It is not affected much by extreme values, which makes it a good measure of what is typical. For the mean, see our guide on how to calculate the mean average, and use both together when you want a fuller picture.